
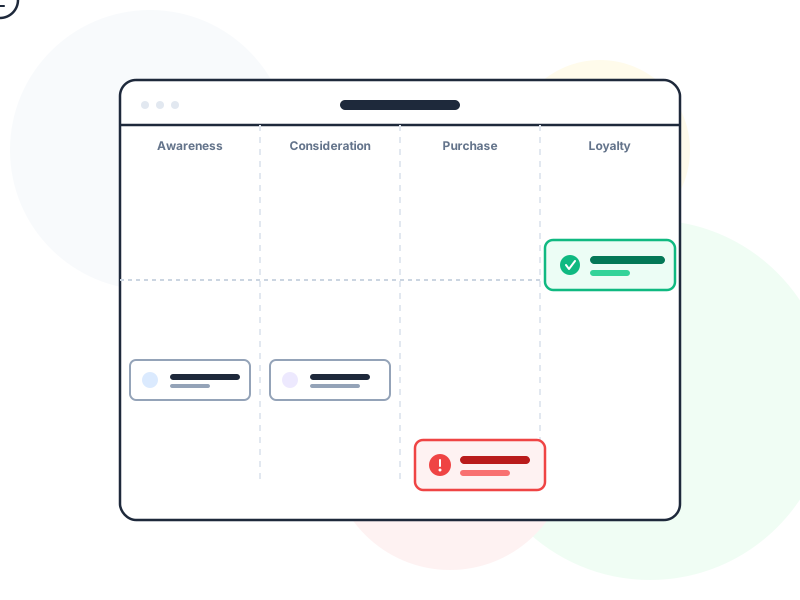
A user journey map is a visual document that tells the story of a user’s complete experience with a product or service – from first awareness through to goal completion – capturing their actions, thoughts, emotions, and the opportunities each stage presents for improvement.
Why It Matters
Most UX work focuses on specific screens or flows. User journey maps zoom out to a level where the full experience – across time, channels, and touchpoints – becomes visible. Problems that live between screens (a customer who calls support because the app didn’t give them the confirmation they expected) only show up when you map the complete journey, not when you review individual UI states.
The insight is often structural rather than tactical. A user journey map might reveal that the biggest pain point in a bank’s onboarding process isn’t the form design – it’s the three-day wait for account activation where users receive zero communication and don’t know if anything is happening. No amount of UI polish fixes that problem. The journey map surfaces it as a system-level issue.
User journey maps are also one of the most effective tools for cross-functional alignment. When sales, support, marketing, and product are all looking at the same visualization of the customer experience – including pain points that happen in each other’s domains – it creates shared ownership of problems that would otherwise stay siloed and unresolved.
Journey Map vs. User Flow
This distinction matters and is consistently confused. A user flow is a linear diagram of the steps a user takes through a specific task within a product – it’s a design artifact that maps actions to screens. It’s focused, functional, and task-scoped.
A user journey map is an experience document. It spans a broader timeframe (often days or weeks), includes emotional states, covers multiple channels (app, email, phone, in-person), and incorporates the user’s context outside the product itself. A journey map might show that a user is anxious when they first open an app because they just read a news article about a data breach – that external context is invisible in a user flow.
Use user flows when designing specific interactions. Use journey maps when trying to understand and improve the overall experience arc.
How It Works
A user journey map is typically organized as a table with time moving left to right across phases, and a set of lanes running top to bottom:
Phases: The major stages of the journey. For an airline booking experience: Awareness → Research → Booking → Pre-flight → Boarding → Post-trip.
Actions: What the user does in each phase. Searches flights on Google, compares prices across tabs, enters payment details, receives confirmation email, checks in via app.
Thoughts: What the user is thinking. “Is this price real or will fees be added?” / “Why do I have to re-enter my passport every time?” Drawn from research – interviews, surveys, support logs, not team assumptions.
Emotions: The user’s emotional state across the journey, often visualized as a curve – rising and falling with the experience. Excitement during research, frustration during booking, anxiety before departure, relief after boarding. The emotional curve is often the most immediately communicative element for stakeholders.
Opportunities: Design and service improvement opportunities surfaced by each phase. This is where the map becomes actionable – each pain point maps to a potential solution space, and often to a specific team responsible.
Supporting elements:
- The map should be anchored to a specific user persona – a leisure traveler and a frequent business traveler have genuinely different journeys, and mixing them produces a map that accurately describes nobody.
- Every lane should be populated with real data – quotes from interviews, behavioral data, support ticket themes – not workshop brainstorming that substitutes for research.
Real-World Example
An airline’s UX team mapped the complete booking-to-boarding journey for a leisure traveler segment. The emotional curve told the story clearly: users were excited and engaged during flight search, increasingly frustrated during seat selection and baggage add-ons, relieved at booking confirmation, and then completely disengaged until 24 hours before the flight – when anxiety spiked sharply around check-in and gate information.
The opportunities column identified three problems that no screen-level UX work had surfaced. First: users in the research phase were consistently leaving the airline’s site to check third-party reviews – the airline’s own customer reviews weren’t visible or trusted. Second: the gap between booking and travel (often weeks) had no meaningful touchpoints beyond a receipt email, leaving users uncertain their booking was actually confirmed. Third: the gate change notification arrived simultaneously with twelve other pre-flight emails, making it easy to miss.
Each finding pointed to a different team – marketing, CRM, and operations respectively – and the journey map created the shared visibility needed to address them collectively rather than each team blaming the others.
How to Apply
- Anchor every map to a specific persona. A journey map for “all users” describes no user. Choose one persona, map their specific journey, and note explicitly where other personas diverge at key decision points.
- Populate from research, not assumptions. User quotes, support ticket themes, behavioral analytics, and session data all feed the map. Team brainstorming alone produces a journey map of your assumptions, which is worse than useless – it validates existing beliefs.
- Make the emotional curve explicit. Visualize it as a line graph rising and falling across phases. This single element often communicates the experience quality more clearly than any amount of text, especially for stakeholders outside the UX team.
- Define the scope before you start. Is this a first-purchase journey? A full customer lifecycle map? A support escalation flow? Scope affects every decision about what to include, and maps without clear scope tend to grow until they’re unreadable.
- Treat it as a living document. Journey maps decay as products and user behavior change. Date every version and build in a regular review cycle – at minimum, revisit after major product changes or new research rounds.
Common Mistakes
Building the map without research. A journey map built entirely in a workshop from team assumptions can be actively harmful – it validates existing beliefs rather than challenging them. At minimum, anchor it to existing research; ideally, run focused interviews first and let users describe their experience in their own words.
Making it too broad. A journey map that spans a user’s entire relationship with a brand over years becomes an abstraction too general to act on. Narrower scope – one journey, one persona, one time horizon – produces more specific and actionable insights.
Forgetting to use it. Journey maps are among the most beautifully produced documents that sit in a shared drive unopened. Build in a review session, link it explicitly to the product roadmap, or connect findings directly to sprint backlogs. A journey map that doesn’t change anything has only the cost with none of the value.
Related Concepts
- Empathy Map – captures the emotional and cognitive layer that journey maps incorporate across the full arc
- User Persona – the anchor that makes journey maps specific and meaningful
- User Flow – the task-level diagram that journey maps contextualize within a broader experience
- Design Thinking – the framework where journey mapping supports the Define and Empathize phases
- Information Architecture – what journey maps often reveal as needing structural redesign