
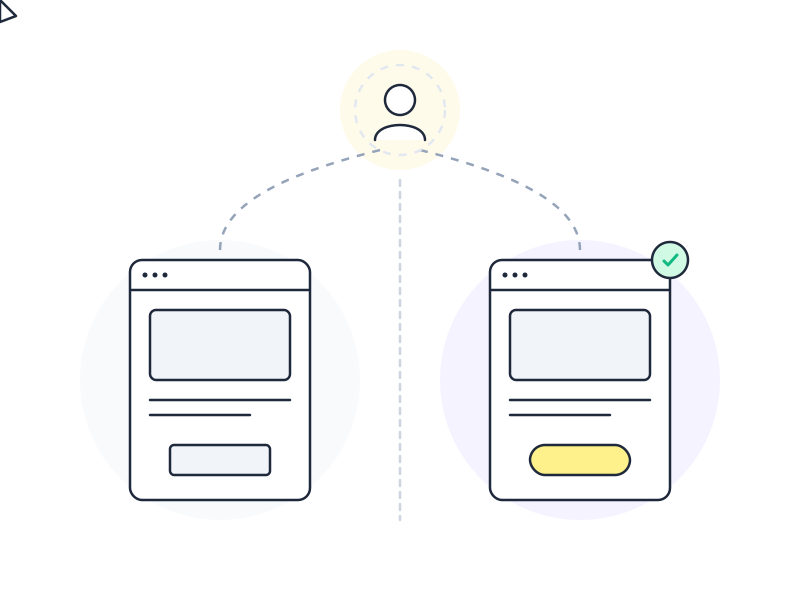
A/B testing is a method for comparing two versions of a design by showing each version to a different segment of users and measuring which one performs better on a specific metric.
Why It Matters
Design decisions are often made by opinion. Senior stakeholders, loudest voices, and gut feelings shape products more than they should. A/B testing in UX gives you a mechanism to replace “I think” with “the data shows.” When Booking.com changed the color and text of a call-to-action button, they didn’t argue about it – they ran a test and let actual user behavior settle the question.
The practical value is about reducing risk. Launching a redesigned checkout flow carries real risk: what if conversion drops? A/B testing lets you expose 10% of your users to the new version, measure the impact, and only roll it out fully if it wins. That’s the difference between a calculated change and a gamble.
It also builds organizational trust in the design process. When you can show that Design Version B increased task completion by 12% at 95% statistical confidence, you’re no longer defending aesthetics – you’re presenting evidence. That changes the conversation in any product team.
How It Works
The core mechanic is simple: split your traffic randomly between two versions (A is the control, B is the variant), then track a specific metric for each group. The test runs until you’ve gathered enough data to be statistically confident the result isn’t just random noise.
The key components:
- Hypothesis: “Changing the CTA from ‘Submit’ to ‘Book Now’ will increase click-through rate.” Be specific – vague tests produce vague learning.
- Metric: What you’re measuring. Primary metric (the one you’re optimizing) plus guardrail metrics (to check you’re not improving one thing while breaking another).
- Sample size: Calculated before the test, not after. Too small a sample means your result could easily be a fluke. Most tools have built-in calculators.
- Statistical significance: Conventionally 95%. This means there’s only a 5% chance the observed difference is random. It’s a threshold, not a guarantee.
- Test duration: Run for complete business cycles – typically two weeks minimum – to avoid day-of-week bias.
When A/B Testing Doesn’t Apply
A/B testing is powerful but not universal. It requires meaningful traffic volumes – typically thousands of users per variant to reach significance for typical conversion metrics. If your product sees 200 visitors a day, you’ll need months to conclude most tests. At that scale, usability testing is a far better use of your time.
It also answers “which performs better” but not “why.” If Version B wins, you still don’t know what about it made the difference. Was it the button color, the text, the placement? Qualitative methods answer the why. A/B testing answers the what.
Don’t run A/B tests to validate fundamental UX decisions that should go through proper usability testing and user flow validation first. Testing a broken experience in two variants just tells you which broken version people dislike less.
Real-World Example
Booking.com is one of the most cited examples of A/B testing culture. Their teams run thousands of tests simultaneously. One representative test type: they tested multiple variations of the “Reserve” CTA – different colors, copy variants like “Book Now,” “Check Availability,” and “See Rooms” – across different property listing pages. The winning variant wasn’t guessed in advance; it emerged from actual booking behavior. Their iterative, test-everything culture lets them optimize continuously without bet-the-company redesigns.
The key lesson: Booking.com doesn’t test because they’re uncertain about design. They test because they know that at scale, even 0.5% conversion improvements compound into significant revenue – and the only way to reliably find those improvements is measurement.
How to Apply
- Define one clear primary metric before you build anything. Click-through rate, form completion, signup – pick one. Tests optimizing for multiple metrics simultaneously are hard to interpret.
- Calculate your required sample size first. Use a free tool like Evan Miller’s sample size calculator. Set your expected minimum detectable effect (the smallest improvement worth detecting) and work backward.
- Run the test for full business cycles. Weekday/weekend behavior differs for most products. Stopping early when you see a leading result is a common mistake – the effect often regresses.
- Set up guardrail metrics. If you’re optimizing CTA clicks, also track bounce rate and session depth. A button that gets more clicks but fewer completions is a net loss.
- Document every test result, including losers. A test that “failed” (B didn’t beat A) is still valuable knowledge – it tells you that the variant hypothesis was wrong, and why.
Common Mistakes
Running tests with insufficient traffic. This is the single most common error. A 10% lift sounds exciting at day three, but with 150 users per variant it’s meaningless noise. Calculate sample size before starting, always.
Testing too many changes at once. If you change the CTA color, text, button size, and page headline simultaneously, and Version B wins, you have no idea which change drove it. Test one meaningful change at a time, or use multivariate testing with proper tooling.
Calling the test early. Peeking at results and stopping when you see significance – before reaching your predetermined sample size – inflates false positive rates dramatically. Set the end conditions before you launch the test.
Related Concepts
- Usability Testing – the qualitative complement; answers why users behave the way they do
- User Flow – mapping the steps that A/B tests optimize
- Heatmap – another quantitative tool for understanding click and scroll behavior
- Dark Pattern – what happens when conversion optimization ignores user wellbeing
- Heuristic Evaluation – expert review that complements data-driven testing